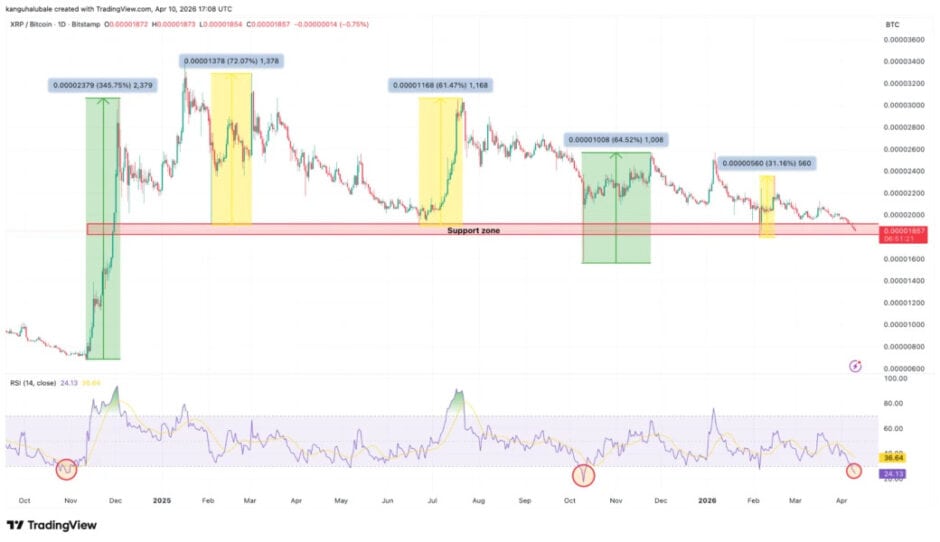
XRP has been falling for eight months, but a convergence of technical and on-chain indicators is now signaling that a macro bottom may be forming. The relative strength index on the XRP/BTC ratio has dropped to 24, the most oversold level since October 2025. Historically, RSI readings this low on the ratio have marked market bottoms that led to XRP price breakouts of 65% to 345% against Bitcoin.
The XRP/BTC pair is currently trading within a long consolidation range that has previously acted as a launching pad. The last time XRP bottomed against Bitcoin around this zone was in June 2025, which marked the beginning of a 61% increase in the XRP/BTC ratio and accompanied a 92% XRP price rally to a multi-year high of $3.66.
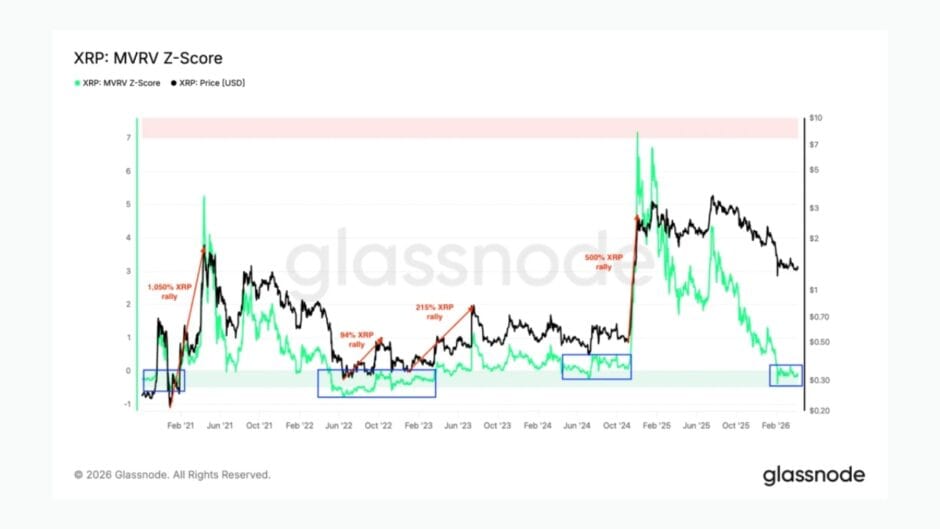
The MVRV Z-score adds further weight to the bottom case. The metric, which measures whether an asset is overvalued or undervalued relative to its realized value, is hovering near zero. This level historically aligns with accumulation zones and market bottoms. Most holders are close to breakeven at current prices, which reduces sell pressure and signals potential downside exhaustion. Similar patterns appeared in 2021, 2022 and 2024 before major rallies. The last time the MVRV Z-score fell to comparable levels was in late 2024, when XRP was trading at $0.30. That marked a macro bottom that preceded a multi-month rally of over 500%, with XRP rising above $3.
The 0.80 MVRV pricing band, which has historically marked cycle bottoms, currently sits at $1.14. XRP hit that level as a 15-month low on February 6 before bouncing. These on-chain metrics suggest XRP is undervalued and could continue recovering toward $1.70 or higher if the current support structure holds.
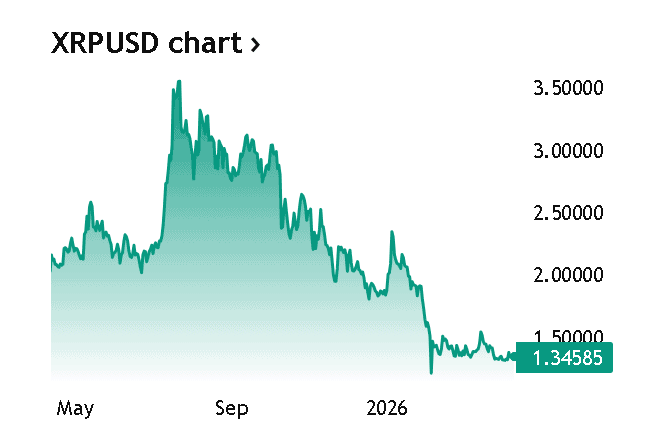
The key level to watch is $1.25 to $1.30. XRP has sustained this support zone since early February 2026. Trader ChiefraT noted on X that if this zone continues to hold, “a short-term bounce towards $1.45 can’t be ruled out.” The importance of this level is reinforced by cost basis distribution data showing that nearly 1.73 billion XRP were acquired around this price, making it a significant demand zone.
Below that, the next line of defence is the $1.15 level, where the 200-week simple moving average sits. If XRP drops below this level, the measured target of the current bear flag pattern points to $0.80, roughly 41% below the current price. For bulls to regain control, they need to push XRP above $1.61, the top of the current range.
XRP is trading around $1.35 at the time of writing. The combination of deeply oversold RSI readings on the BTC ratio, an MVRV Z-score near zero, strong cost basis support at $1.30 and whale accumulation of over 4 billion tokens since October 2025 paints a picture of an asset sitting at levels that have historically preceded significant recoveries. Whether that pattern repeats depends on broader market conditions and whether Bitcoin dominance, currently above 57%, begins to roll over in favour of altcoins.