Bitcoin may be on track to reclaim the $100,000 mark before October 2026, according to several bullish technical indicators that have emerged following the cryptocurrency’s recent recovery from key support levels.
The world’s largest cryptocurrency has rebounded more than 13 percent from its recent lows below $60,000, benefiting from improved global market sentiment after easing geopolitical tensions and renewed investor appetite for risk assets.
Market analysts point to a developing double-bottom formation on Bitcoin’s three-day chart, a technical pattern often associated with major trend reversals.
Bitcoin has successfully defended the $60,000 support zone twice this year, suggesting strong buying interest at that level. The first bottom was established during the March correction, while the second emerged following June’s sell-off.
If the pattern is confirmed, Bitcoin would need to break above its neckline resistance near $81,000. A successful breakout could trigger a measured move toward $108,000, representing more than 60 percent upside from current levels.
Another positive signal comes from Bitcoin’s weekly Relative Strength Index (RSI), which is displaying a bullish divergence.
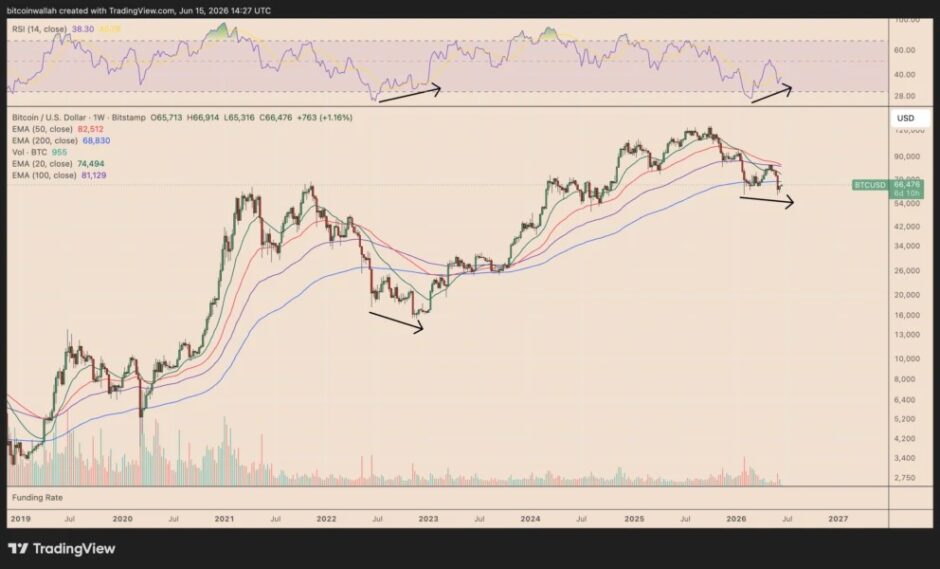
While Bitcoin recently recorded a lower price low near the $60,000-$65,000 range, the RSI formed a higher low. This divergence often indicates weakening selling pressure and can precede a significant upward move.
Analysts note that a similar pattern appeared during Bitcoin’s 2022 market bottom, which was followed by a prolonged recovery and the start of a new bullish cycle.
Key resistance levels currently sit near $74,500 and $82,500. A sustained move above these levels would significantly improve the chances of a rally toward six-figure territory later this year.
Despite the optimistic outlook, analysts caution that Bitcoin still faces important short-term challenges.
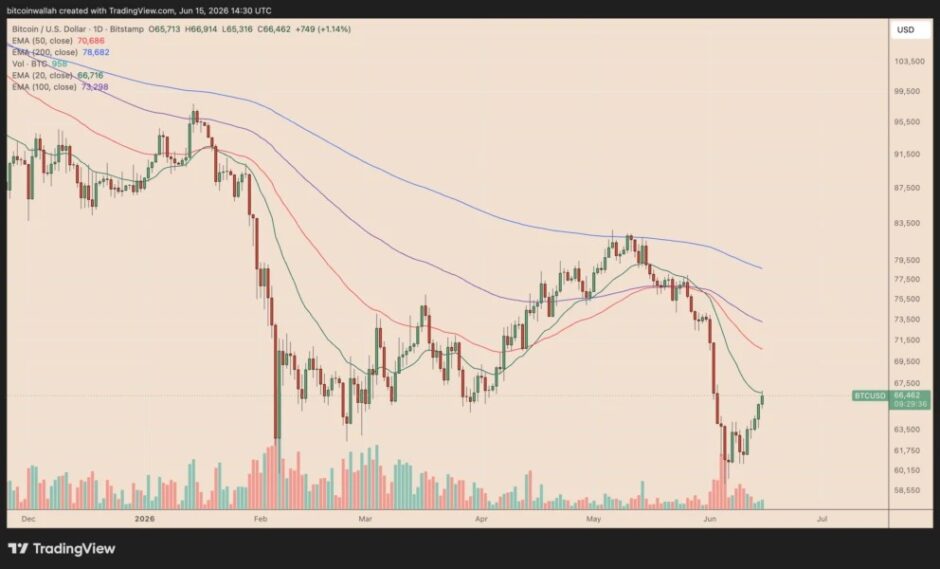
The cryptocurrency is currently testing resistance around $66,700, where the upper boundary of a bear flag pattern intersects with a major moving average. Failure to break above this level could trigger another decline toward $63,600.
A breakdown below that support could activate the bear flag pattern and expose Bitcoin to a potential drop toward $53,850, roughly 20 percent below current prices.
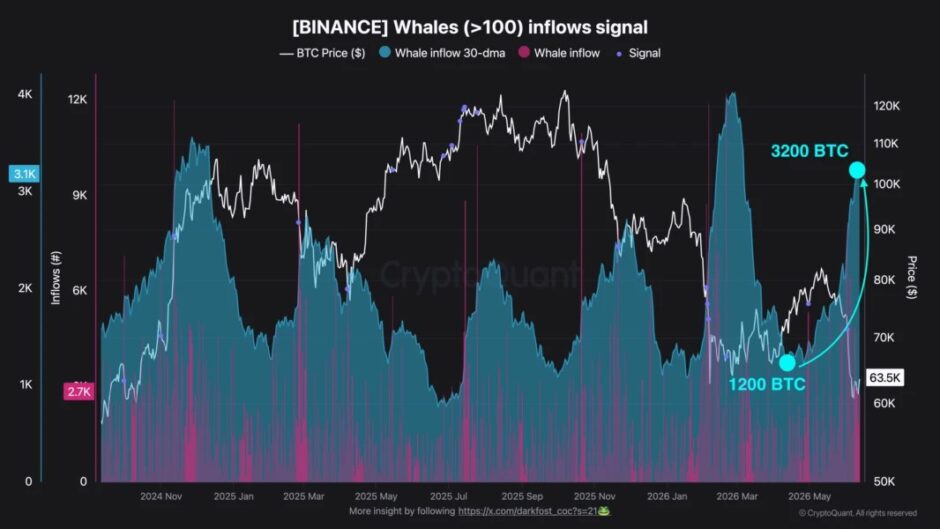
On-chain data also suggests that large Bitcoin holders remain active sellers.
According to market analysts, whale inflows to major cryptocurrency exchanges have increased notably following Bitcoin’s recent correction. Large investors reportedly transferred an average of 3,200 BTC per day to exchanges over the past month, compared with approximately 1,200 BTC per day at the end of April.
Rising exchange inflows are often viewed as a sign that large holders may be preparing to sell, potentially creating additional short-term pressure on prices.
While technical indicators increasingly support a move toward $100,000, analysts emphasize that Bitcoin must first overcome several key resistance levels and maintain support above the $60,000 area.
If bullish momentum continues and broader market conditions remain favorable, Bitcoin could potentially challenge six-figure prices before October. However, traders remain cautious as elevated whale activity and unresolved resistance levels continue to pose risks to the recovery.