Microsoft is advancing its observability efforts by introducing OpenTelemetry support to more Azure services, with Azure Logic Apps (Standard and Hybrid) and Azure Functions now supporting the popular open-source framework. The integration is currently available in public preview for Azure Functions.
OpenTelemetry (OTel) is a project under the Cloud Native Computing Foundation (CNCF) that standardizes the way logs, traces, and metrics are collected and exported. By eliminating vendor-specific instrumentation, OpenTelemetry ensures seamless interoperability across tools like Azure Monitor, Grafana Tempo, and Jaeger.
What’s new in Azure Logic Apps and functions?
With this update, Microsoft aims to enhance diagnostic capabilities in hybrid, on-premises, and cloud-native deployments:
- For Azure Logic Apps, particularly in hybrid environments, OTel enables more consistent and correlated telemetry across host and application code.
- In Azure Functions, OpenTelemetry goes beyond Application Insights, offering standards-based tracing, though some preview limitations apply.
How to enable it?
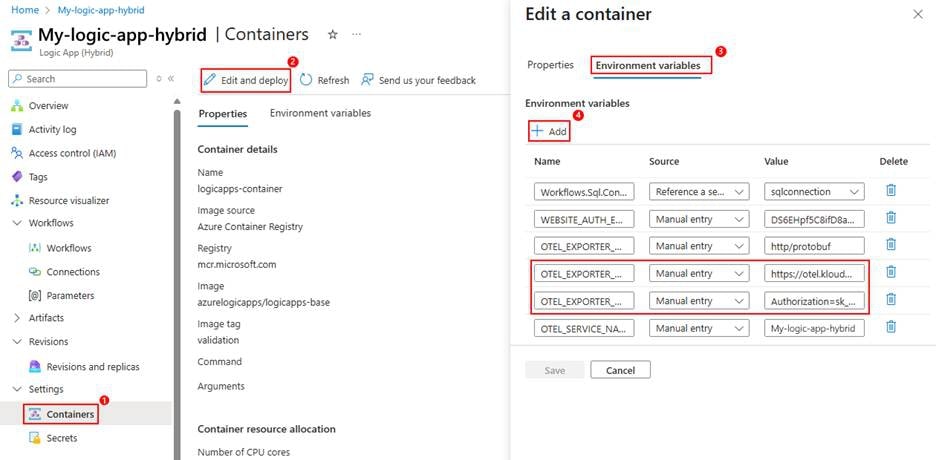
To activate OpenTelemetry in these services, users must configure the host.json file with “telemetryMode”: “OpenTelemetry”. They must also set environment variables such as:
- OTEL_EXPORTER_OTLP_ENDPOINT – defines the exporter’s destination
- OTEL_EXPORTER_OTLP_HEADERS – optional headers for custom configuration
This can be done through Visual Studio Code or directly in the Azure Portal, depending on the hosting model (Workflow Standard Plan, App Service Environment v3, or Hybrid Containers).
Microsoft’s Broader Strategy Around Observability
OpenTelemetry isn’t just coming to Logic Apps and Functions; it’s becoming a foundation across Microsoft’s observability ecosystem.
Key components include:
Azure Monitor OpenTelemetry Distro
A Microsoft-supported distribution of OpenTelemetry SDKs, providing out-of-the-box instrumentation for .NET, Java, JavaScript (Node.js), and Python. It supports automatic instrumentation for Java and Python apps hosted in App Service and Java Functions.
Azure SDKs
These use OpenTelemetry APIs to emit HTTP and messaging tracing semantics, enabling end-to-end visibility.
.NET Aspire
A cloud-native development stack that includes built-in observability. Its Developer Dashboard lets developers observe real-time OpenTelemetry signals during local debugging.
“We’re building first-class support for Azure Functions in Aspire, and I am very excited. We’re making changes to enable open telemetry everywhere, and to make local development against various emulators seamless.” — David Fowler, Microsoft
Other Azure Services Getting the OpenTelemetry Boost
- Azure Monitor Application Insights now benefits from OTel with improved tools like Application Map and Transaction Search.
- Azure Container Apps ship with a pre-integrated OpenTelemetry agent, which exports data using OTLP-compatible endpoints with no manual setup.
- Edge and Multicloud Scenarios are covered by tools such as the OpenTelemetry Collector, Azure Data Explorer Exporter, and Azure Monitor pipeline at edge (currently in public preview).
What’s supported today?
- Azure Logic Apps: HTTP, Service Bus, and Event Hub trigger types are supported. Metrics export is not yet available.
- Azure Functions: Still in public preview. Some limitations apply, such as the Azure portal not supporting log streaming or recent invocation traces when using OTel.
Microsoft is clearly committing to an OpenTelemetry-first approach across its cloud platforms. With this move, developers and enterprises can now enjoy a more uniform, flexible, and open observability experience, from app code to cloud infrastructure and hybrid environments.